Table of Contents
Overview
The Section Chart types provide the possibility to represent the data in different chart and diagram view on the screens in the Render application. Currently, we support various types of charts. Below you can explore different chart types and check examples of chart usage.
Section Settings
To configure the section settings as well as chart configurations, click the gear icon in the right upper corner of the section.
In the opened pop-up window, you can configure the general settings connected to the section as well as the settings related to the charts. The general section settings are described on the Screens page. The setting and parameters that should be set up to charts depend on what type of char is selected in the Section Type field. See the details about every chart further.
Note that the layout configuration for the chart type is very similar to the table type, but the data will be displayed according to the selected Section type.
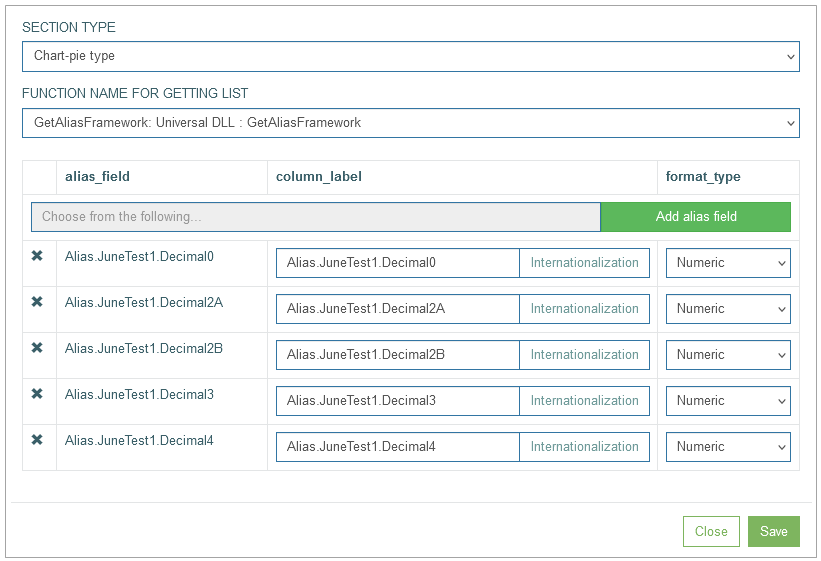
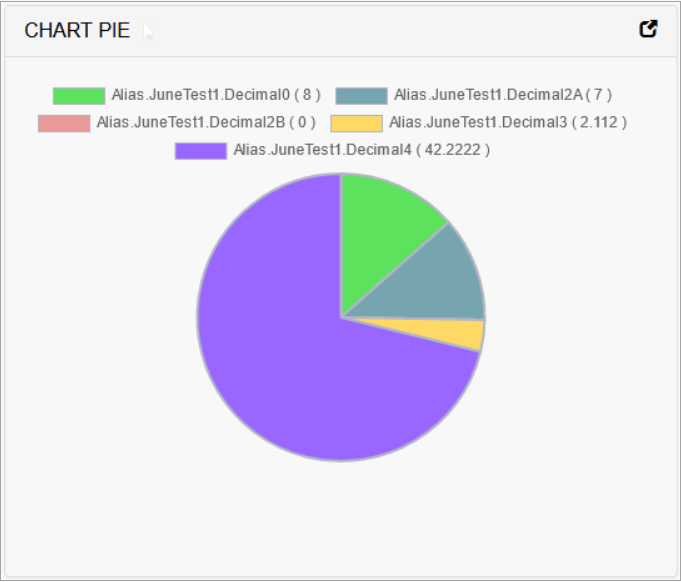
Pie Chart
To represent the data in the pie chart view, set up the following parameters:
Section Type - select chart-pie type.
Function name for getting list - the value should be pre-defined automatically.
Alias Field - define the alias for the field data to be displayed in the pie chart.
Column Label (Section chart label) - define the label to be displayed in the pie chart for the corresponding alias field.
Internationalization - click the button to add translations for other supported languages, if needed.
Format type - select the Format Type from the drop-down list. The list of available options is restricted by the table field.
The configured pie chart looks on the screen in the Render as follows:
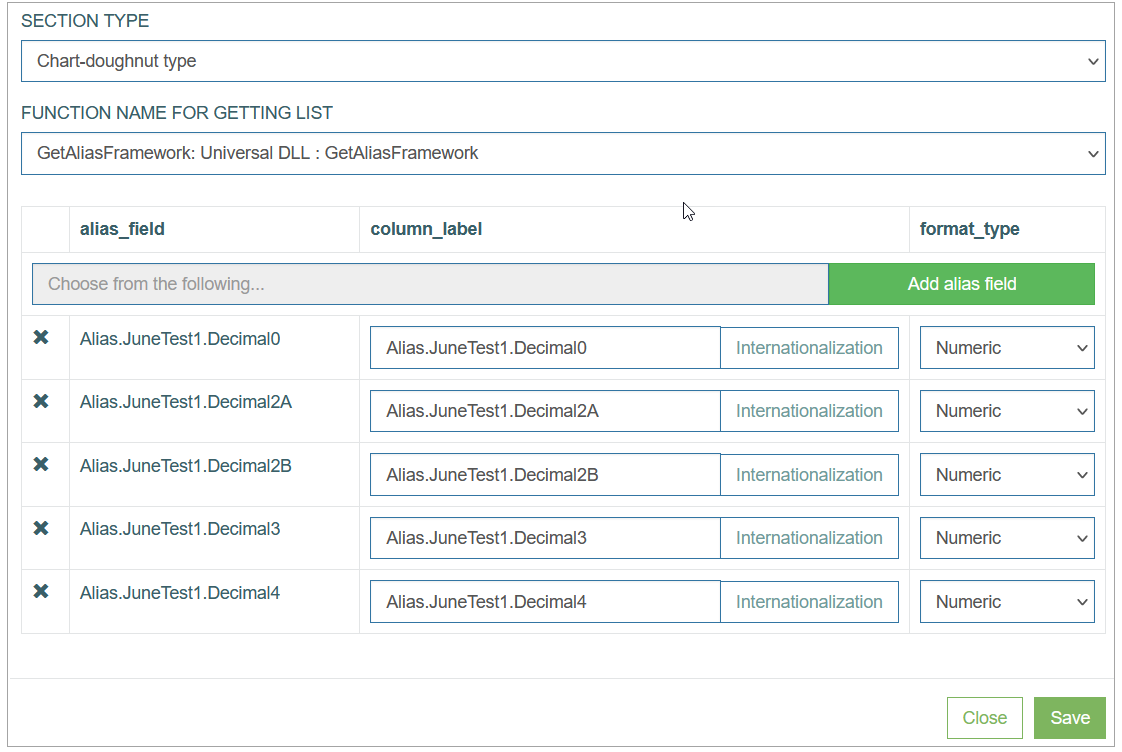
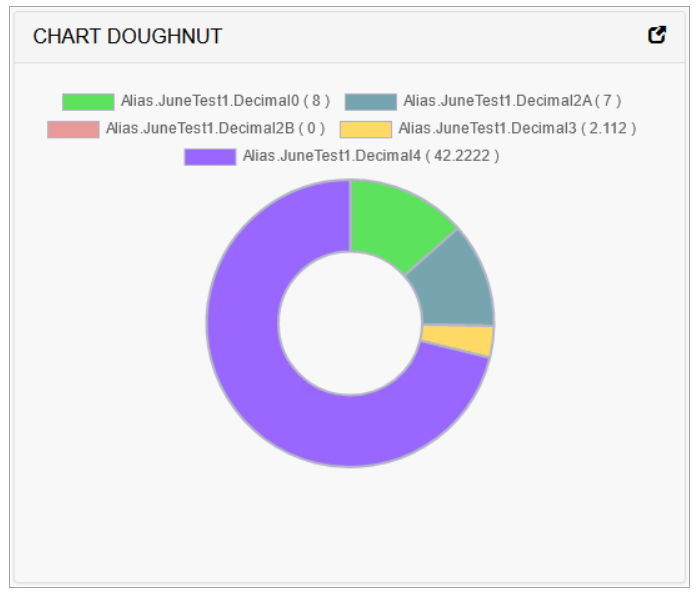
Doughnut Chart
To represent the data in the doughnut chart view, open the Section settings and set up the following parameters:
Section Type - select chart-doughnut type.
Function name for getting list - the value should be pre-defined automatically.
Alias Field - define the alias for the field data to be displayed in the doughnut chart.
Column Label (Section chart label) - define the label to be displayed in the doughnut chart for the corresponding alias field.
Internationalization - click the button to add translations for other supported languages, if needed.
Format type - select the Format Type from the drop-down list.
The list of available options is restricted by the table field.
The configured doughnut chart looks on the screen in the Render as follows:
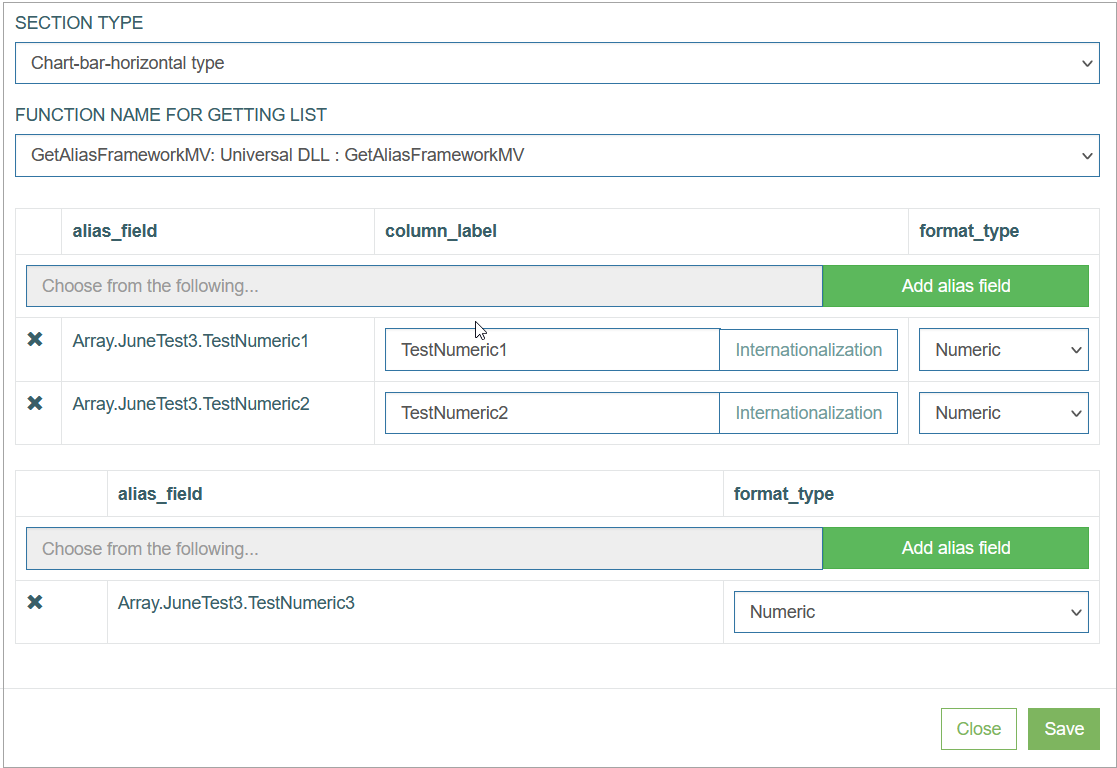
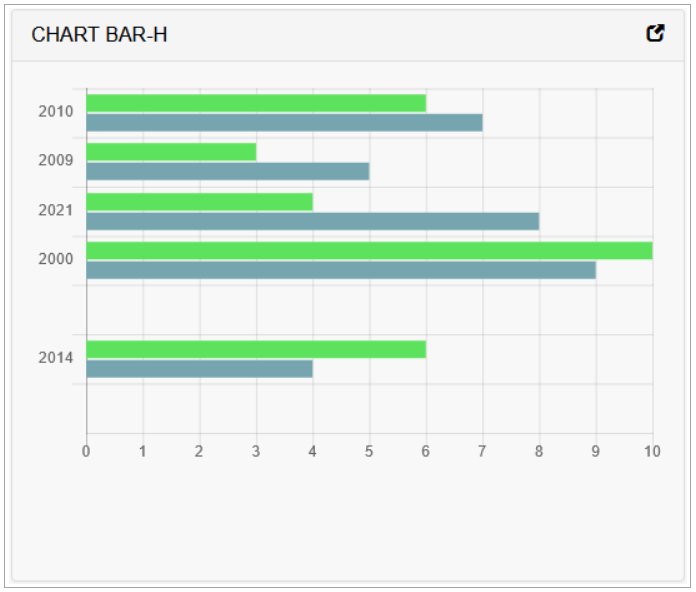
Horizontal Bar Chart
To represent the data in the horizontal bar chart view, set up the following parameters:
Section Type - select the chart-bar-horizontal type.
Function name for getting list - the value should be pre-defined automatically.
Note that at first the data fields for the Y axis should be defined. Thereafter, the data fields for the X axis will be defined.
Alias Field - define the alias for the field data to be displayed in the bar chart.
Column Label (Section chart label) - define the label to be displayed in the bar chart for the corresponding alias field.
Internationalization - click the button to add translations for other supported languages, if needed.
Format type - select the Format Type from the drop-down list. The list of available options is restricted by the table field.
The configured horizontal bar chart looks on the screen in the Render as follows:
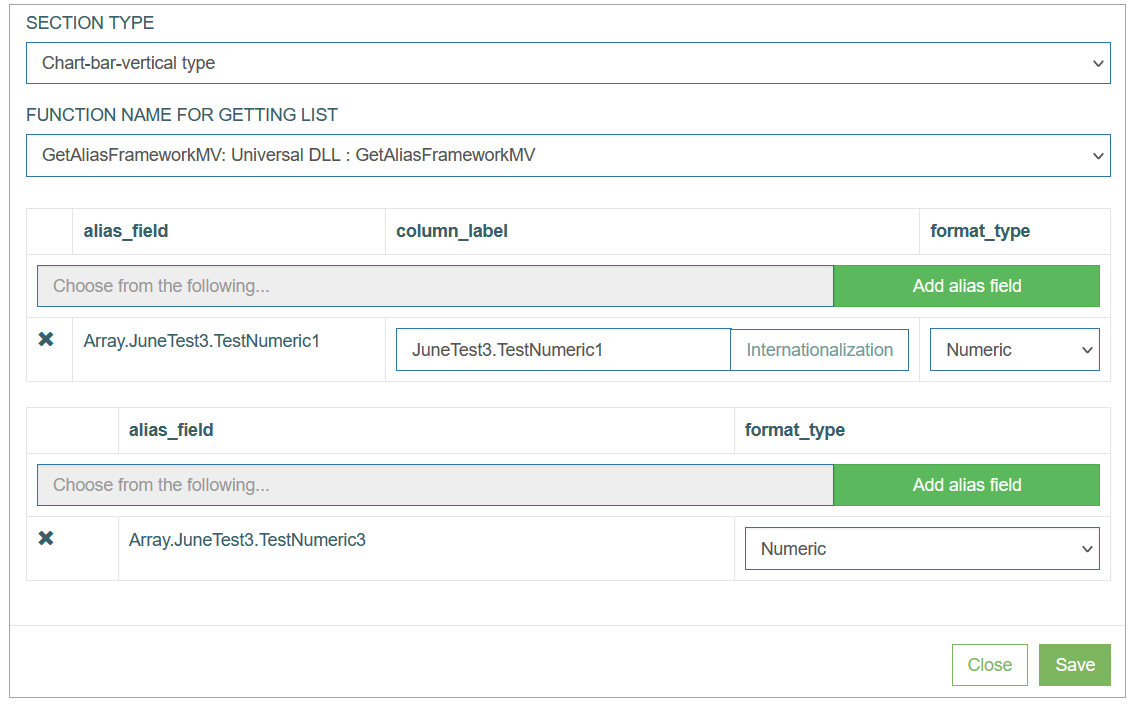
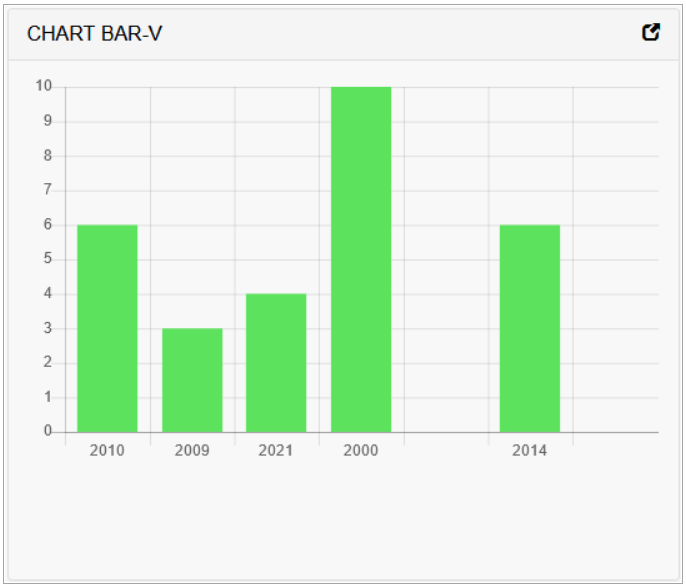
Vertical Bar Chart
To represent the data in the vertical bar chart view, set up the following parameters:
Section Type - select the chart-bar-vertical type.
Function name for getting list - the value should be pre-defined automatically.
Note that at first the data fields for the Y axis should be defined. Thereafter, the data fields for the X axis will be defined.
Alias Field - define the alias for the field data to be displayed in the vertical bar chart.
Column Label (Section chart label) - define the label to be displayed in the vertical bar chart for the corresponding alias field.
Internationalization - click the button to add translations for other supported languages, if needed.
Format type - select the Format Type from the drop-down list. The list of available options is restricted by the table field.
The configured vertical bar chart looks on the screen in the Render as follows:
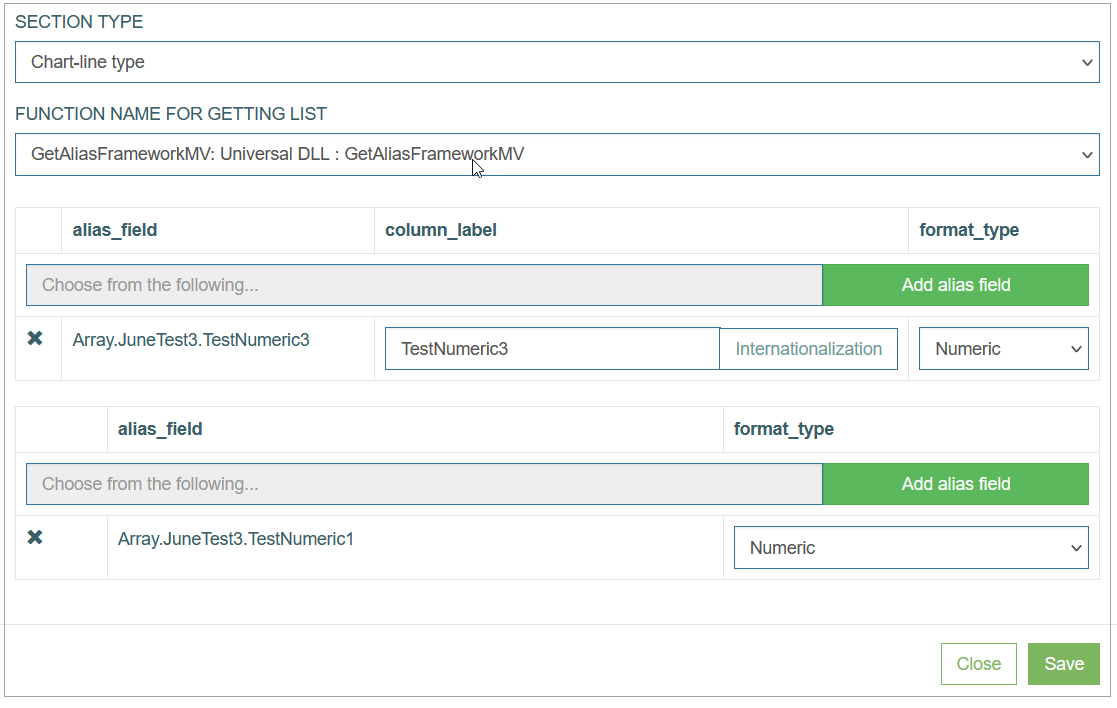
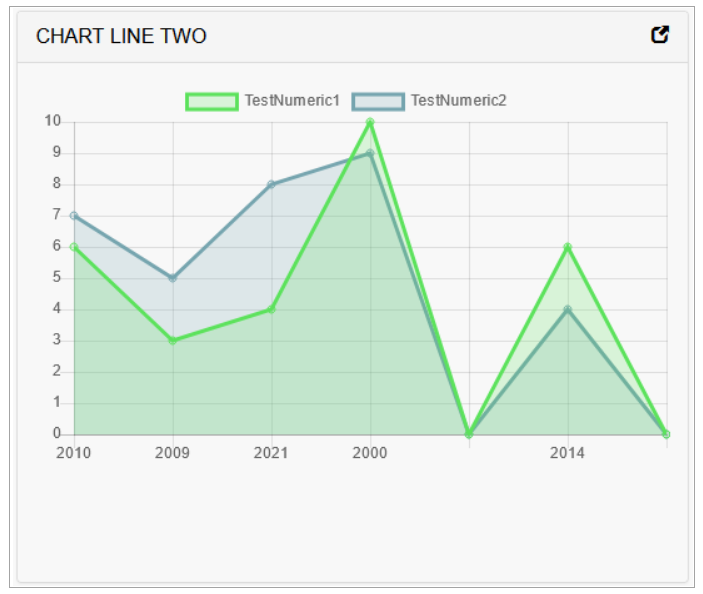
Line Chart
To represent the data in the vertical line chart view, set up the following parameters:
Section Type - select the chart-line type.
Function name for getting list - the value should be pre-defined automatically.
Note that at first the data fields for the Y axis should be defined. Thereafter, the data fields for the X axis will be defined.
Alias Field - define the alias for the field data to be displayed in the line chart.
Column Label (Section chart label) - define the label to be displayed in the line chart for the corresponding alias field.
Internationalization - click the button to add translations for other supported languages, if needed.
Format type - select the Format Type from the drop-down list. The list of available options is restricted by the table field.
The configured line chart looks on the screen in the Render as follows:
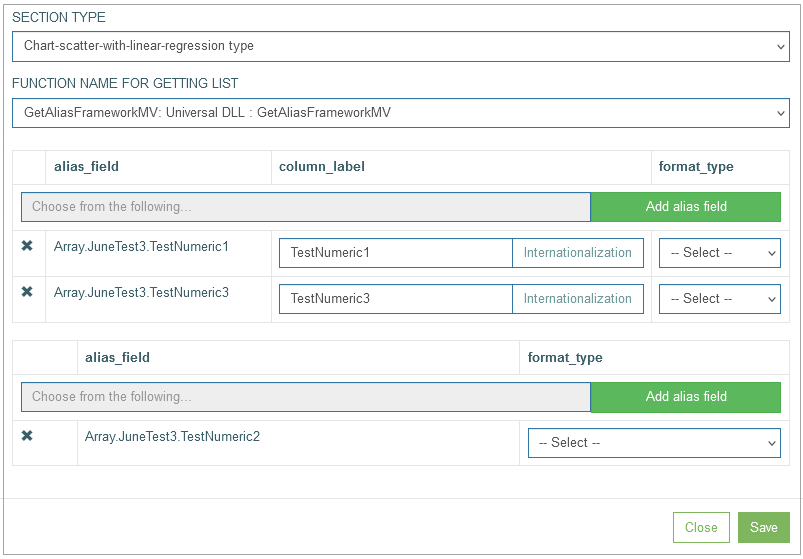
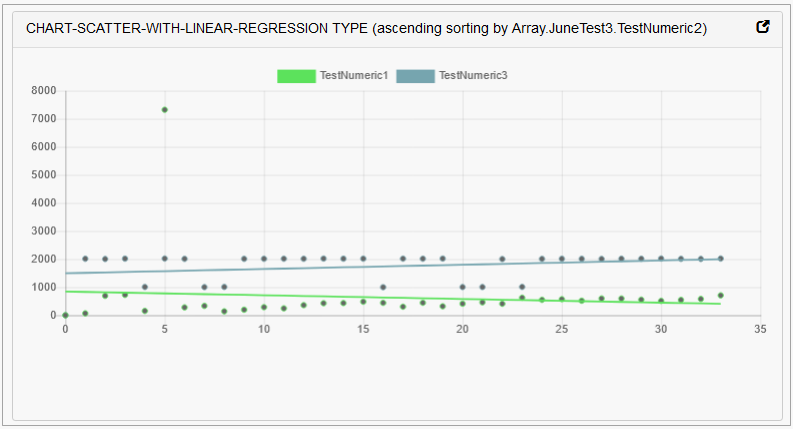
Scatter Chart with Linear Regression
To represent the data in the scatter chart with linear regression view, set up the following parameters:
Section Type - select the chart-scatter-with-linear-regression type.
Function name for getting list - the value should be pre-defined automatically.
Note that at first the data fields for the Y axis should be defined. Thereafter, the data fields for the X axis will be defined.
Alias Field - define the alias for the field data to be displayed in the scatter chart with linear regression.
Column Label (Section chart label) - define the label to be displayed in the scatter chart with linear regression for the corresponding alias field.
Internationalization - click the button to add translations for other supported languages, if needed.
Format type - select the Format Type from the drop-down list. The list of available options is restricted by the table field.
The configured scatter chart with linear regression looks on the screen in the Render as follows:
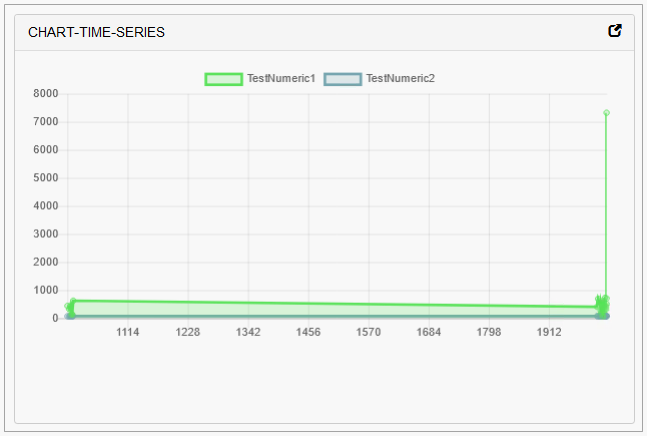
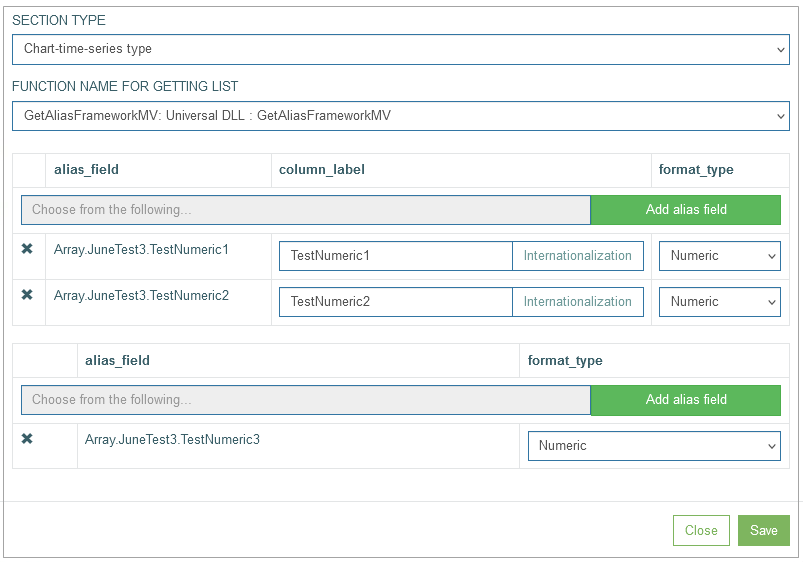
Time Series Chart
To represent the data in the time series chart view, set up the following parameters:
Section Type - select the chart-time-series type.
Function name for getting list - the value should be pre-defined automatically.
Note that at first the data fields for the Y axis should be defined. Thereafter, the data fields for the X axis will be defined.
Alias Field - define the alias for the field data to be displayed in the time series chart.
Column Label (Section chart label) - define the label to be displayed in the time series chart for the corresponding alias field.
Internationalization - click the button to add translations for other supported languages, if needed.
Format type - select the Format Type from the drop-down list. The list of available options is restricted by the table field.
The configured time series chart looks on the screen in the Render as follows: